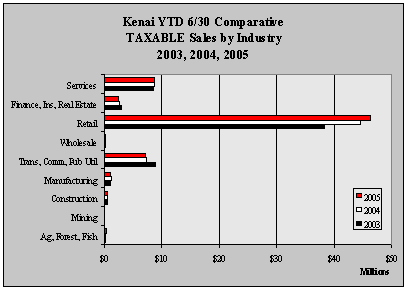
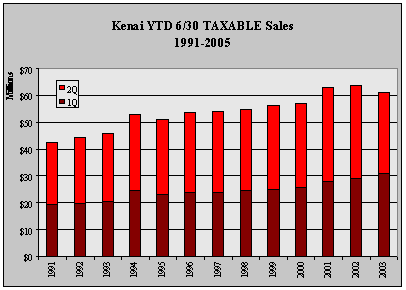
| Kenai YTD 6/30 TAXABLE Sales by
Industry - 1999-2005 - in $ |
| |
1999 |
2000 |
2001 |
2002 |
2003 |
2004 |
2005 |
Annual
Change |
| Ag,
Forest, Fish |
204,569 |
206,713 |
201,331 |
219,165 |
222,677 |
256,638 |
328,585 |
28.0% |
| Mining |
13,948 |
63,085 |
131,380 |
108,849 |
80,842 |
121,402 |
116,614 |
-3.9% |
| Construction |
534,081 |
493,393 |
505,869 |
521,974 |
538,162 |
564,997 |
521,128 |
-7.8% |
| Manufacturing |
932,180 |
1,114,301 |
1,122,782 |
972,235 |
1,128,627 |
1,312,672 |
1,135,560 |
-13.5% |
| Trans,
Comm, Pub Util |
6,807,788 |
7,109,572 |
6,562,159 |
7,574,722 |
8,988,082 |
7,407,338 |
7,100,369 |
-4.1% |
| Wholesale |
374,813 |
428,496 |
386,290 |
254,776 |
191,402 |
279,919 |
216,139 |
-22.8% |
| Retail |
36,566,887 |
36,902,514 |
41,854,555 |
41,562,063 |
38,308,854 |
44,462,370 |
46,202,612 |
3.9% |
| Finance,
Ins, Real Estate |
2,468,971 |
2,549,746 |
3,197,712 |
3,329,627 |
2,975,487 |
2,601,751 |
2,363,739 |
-9.1% |
| Services |
8,185,622 |
8,201,342 |
8,915,832 |
9,044,496 |
8,460,897 |
8,791,562 |
8,789,321 |
0.0% |
| Government |
223 |
256 |
0 |
0 |
0 |
0 |
0 |
NA
|
| Total |
56,088,859 |
57,069,162 |
62,877,910 |
63,587,907 |
60,895,030 |
65,798,649 |
66,774,067 |
1.5% |
| Annual
Change |
|
1.7% |
10.2% |
1.1% |
-4.2% |
8.1% |
1.5% |
|
|


