| Other
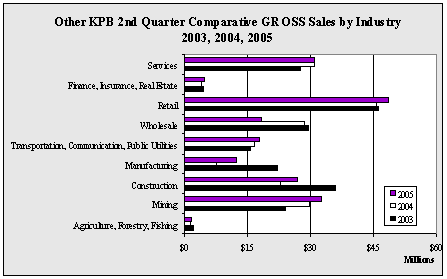
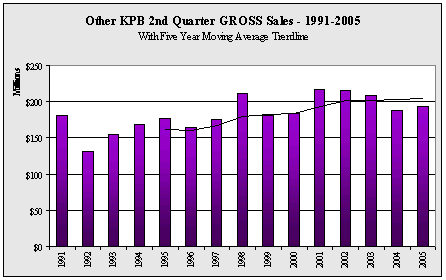
KPB 2nd Quarter GROSS Sales by Industry - 1999-2005 - in $ |
| |
1999 |
2000 |
2001 |
2002 |
2003 |
2004 |
2005 |
Annual
Change |
| Agriculture,
Forestry, Fishing |
1,006,214 |
895,333 |
1,133,165 |
1,142,492 |
2,042,231 |
1,256,193 |
1,534,670 |
22.2% |
| Mining |
25,197,119 |
25,208,965 |
25,603,580 |
29,103,164 |
24,039,296 |
29,692,204 |
32,627,706 |
9.9% |
| Construction |
20,589,328 |
20,599,714 |
26,755,464 |
30,778,098 |
35,948,201 |
22,797,683 |
26,883,481 |
17.9% |
| Manufacturing |
29,640,273 |
26,397,183 |
46,327,693 |
34,871,253 |
22,050,431 |
7,606,427 |
12,354,584 |
62.4% |
| Transportation,
Communication, Public Utilities |
18,812,079 |
15,437,379 |
17,129,688 |
18,167,731 |
15,634,861 |
16,722,028 |
17,782,494 |
6.3% |
| Wholesale |
23,318,497 |
26,003,440 |
25,989,525 |
28,469,316 |
29,652,374 |
28,462,396 |
18,490,308 |
-35.0% |
| Retail |
34,927,187 |
37,452,274 |
41,399,338 |
40,486,870 |
46,326,072 |
45,753,591 |
48,491,068 |
6.0% |
| Finance,
Insurance, Real Estate |
4,083,396 |
3,698,979 |
4,648,250 |
3,704,383 |
4,574,602 |
3,931,587 |
4,762,307 |
21.1% |
| Services |
23,135,453 |
28,284,250 |
28,661,264 |
28,996,481 |
27,700,199 |
30,871,120 |
31,050,604 |
0.6% |
| Government |
0 |
0 |
0 |
0 |
0 |
0 |
0 |
NA
|
| Total |
180,709,546 |
183,977,517 |
217,647,967 |
215,719,788 |
207,968,267 |
187,093,229 |
193,977,222 |
3.7% |
| Annual
Change |
|
1.8% |
18.3% |
-0.9% |
-3.6% |
-10.0% |
3.7% |
|
|


