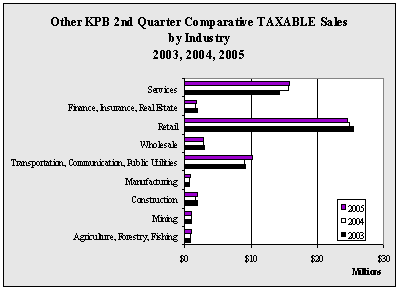
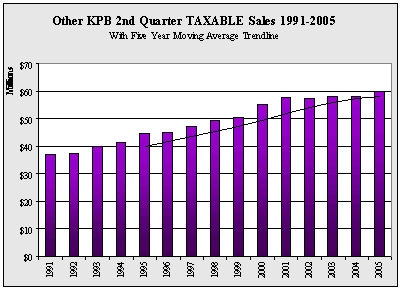
| Other
KPB 2nd Quarter TAXABLE Sales by Industry - 1999-2005 - in $ |
| |
1999 |
2000 |
2001 |
2002 |
2003 |
2004 |
2005 |
Annual
Change |
| Agriculture,
Forestry, Fishing |
624,351 |
688,139 |
755,318 |
780,587 |
859,055 |
915,588 |
955,900 |
4.4% |
| Mining |
926,985 |
1,046,589 |
1,265,086 |
1,417,403 |
1,114,615 |
1,018,997 |
973,689 |
-4.4% |
| Construction |
1,362,150 |
1,500,309 |
1,568,794 |
1,657,737 |
1,889,809 |
1,724,460 |
1,856,552 |
7.7% |
| Manufacturing |
902,042 |
935,882 |
892,944 |
881,441 |
792,161 |
785,263 |
923,221 |
17.6% |
| Transportation,
Communication, Public Utilities |
9,207,004 |
9,290,261 |
9,844,493 |
11,314,077 |
9,184,673 |
8,908,793 |
10,277,879 |
15.4% |
| Wholesale |
2,231,807 |
2,624,808 |
2,722,910 |
2,743,971 |
2,930,861 |
2,862,301 |
2,908,019 |
1.6% |
| Retail |
20,784,479 |
22,911,114 |
24,014,664 |
23,266,764 |
25,345,609 |
24,688,643 |
24,578,036 |
-0.4% |
| Finance,
Insurance, Real Estate |
1,494,811 |
1,494,929 |
1,692,258 |
1,626,536 |
1,841,058 |
1,680,137 |
1,800,494 |
7.2% |
| Services |
13,212,897 |
14,713,026 |
15,114,615 |
13,671,993 |
14,212,739 |
15,603,491 |
15,832,188 |
1.5% |
| Government |
0 |
0 |
0 |
0 |
0 |
0 |
0 |
NA
|
| Total |
50,746,526 |
55,205,057 |
57,871,082 |
57,360,509 |
58,170,580 |
58,187,673 |
60,105,978 |
3.3% |
| Annual
Change |
|
8.8% |
4.8% |
-0.9% |
1.4% |
0.0% |
3.3% |
|
|


