| Other
KPB YTD 6/30 GROSS Sales by Industry - 1999-2005 - in $ |
| |
1999 |
2000 |
2001 |
2002 |
2003 |
2004 |
2005 |
Annual
Change |
| Agriculture,
Forestry, Fishing |
1,358,425 |
1,247,615 |
1,678,643 |
1,590,143 |
2,487,316 |
1,694,447 |
2,013,634 |
18.8% |
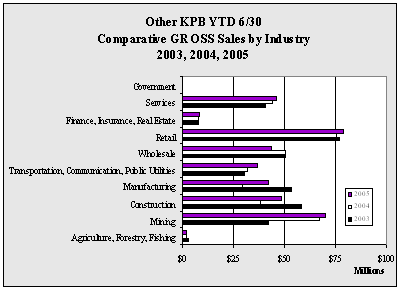
| Mining |
59,647,978 |
43,489,424 |
52,852,431 |
61,402,416 |
42,178,318 |
67,364,432 |
70,093,008 |
4.1% |
| Construction |
31,104,194 |
32,747,954 |
48,462,080 |
55,384,048 |
57,972,494 |
37,935,026 |
48,786,758 |
28.6% |
| Manufacturing |
49,144,018 |
46,359,763 |
87,384,091 |
49,825,823 |
53,712,724 |
29,549,699 |
42,252,159 |
43.0% |
| Transportation,
Communication, Public Utilities |
36,812,851 |
31,124,269 |
33,850,617 |
36,588,703 |
30,232,931 |
31,681,467 |
36,685,098 |
15.8% |
| Wholesale |
41,106,850 |
45,620,628 |
46,261,644 |
50,412,457 |
50,600,896 |
50,494,264 |
43,645,976 |
-13.6% |
| Retail |
57,085,718 |
63,440,415 |
68,572,844 |
69,239,003 |
77,099,916 |
75,797,556 |
78,860,721 |
4.0% |
| Finance,
Insurance, Real Estate |
7,230,938 |
6,737,912 |
7,916,561 |
6,919,245 |
7,376,114 |
7,671,375 |
8,017,772 |
4.5% |
| Services |
34,665,546 |
39,874,518 |
41,219,266 |
43,738,911 |
40,671,355 |
44,069,114 |
46,032,294 |
4.5% |
| Government |
0 |
0 |
0 |
0 |
0 |
6,365 |
13,317 |
109.2% |
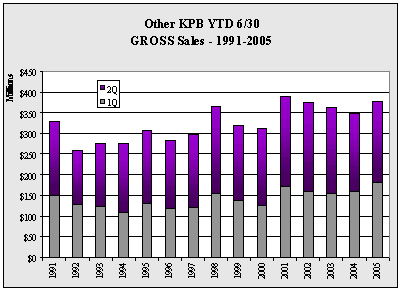
| Total |
318,156,518 |
310,642,498 |
388,198,177 |
375,100,749 |
362,332,064 |
346,263,745 |
376,400,737 |
8.7% |
| Annual
Change |
|
-2.4% |
25.0% |
-3.4% |
-3.4% |
-4.4% |
8.7% |
|
|