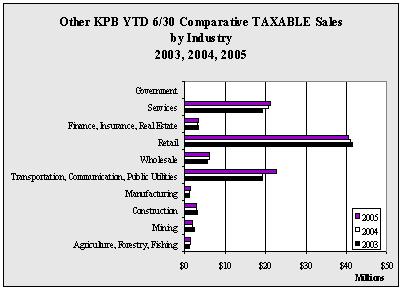
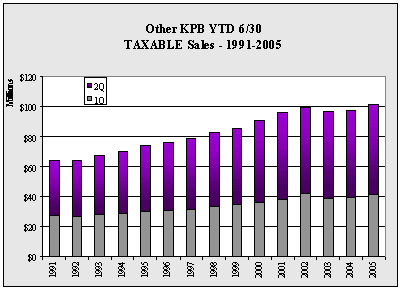
| Other KPB YTD 6/30 TAXABLE Sales
by Industry - 1999-2005 - in $ |
| |
1999 |
2000 |
2001 |
2002 |
2003 |
2004 |
2005 |
Annual
Change |
| Agriculture,
Forestry, Fishing |
875,083 |
984,247 |
1,099,152 |
1,177,104 |
1,219,206 |
1,318,479 |
1,383,478 |
4.9% |
| Mining |
1,683,259 |
1,916,427 |
2,424,873 |
2,841,477 |
2,304,740 |
1,996,163 |
1,985,156 |
-0.6% |
| Construction |
2,378,252 |
2,446,830 |
2,647,523 |
2,789,792 |
3,034,248 |
2,904,620 |
2,998,777 |
3.2% |
| Manufacturing |
1,291,165 |
1,283,455 |
1,301,057 |
1,278,092 |
1,147,304 |
1,153,164 |
1,321,318 |
14.6% |
| Transportation,
Communication, Public Utilities |
19,411,130 |
19,195,294 |
20,282,481 |
23,454,900 |
19,101,385 |
19,167,428 |
22,641,095 |
18.1% |
| Wholesale |
4,414,317 |
5,137,992 |
5,303,572 |
5,609,365 |
5,704,576 |
6,190,487 |
6,122,164 |
-1.1% |
| Retail |
34,105,699 |
37,384,584 |
39,284,302 |
39,575,919 |
41,482,432 |
40,786,875 |
40,477,500 |
-0.8% |
| Finance,
Insurance, Real Estate |
2,779,459 |
2,725,611 |
3,020,218 |
3,133,212 |
3,293,835 |
3,161,439 |
3,209,198 |
1.5% |
| Services |
18,156,630 |
19,826,978 |
20,563,163 |
19,305,532 |
19,268,527 |
20,583,905 |
21,001,759 |
2.0% |
| Government |
0 |
0 |
0 |
0 |
0 |
6,300 |
13,317 |
NA
|
| Total |
85,094,994 |
90,901,418 |
95,926,341 |
99,165,393 |
96,556,253 |
97,268,860 |
101,153,762 |
4.0% |
| Annual
Change |
|
6.8% |
5.5% |
3.4% |
-2.6% |
0.7% |
4.0% |
|
|


