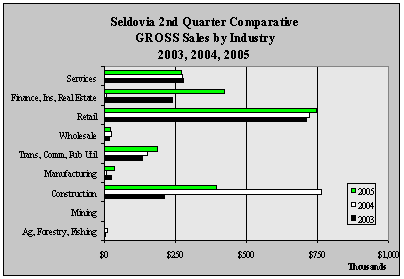
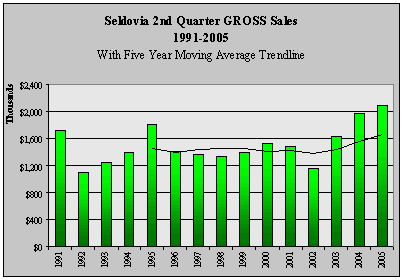
| Seldovia 2nd Quarter GROSS Sales
by Industry - 1999-2005 - in $ |
| |
1999 |
2000 |
2001 |
2002 |
2003 |
2004 |
2005 |
Annual
Change |
| Ag,
Forestry, Fishing |
2,605 |
2,797 |
3,707 |
6,306 |
5,737 |
11,260 |
0 |
-100.0% |
| Mining |
0 |
0 |
0 |
0 |
0 |
0 |
0 |
NA |
| Construction |
33,314 |
248,864 |
287,028 |
42,719 |
213,775 |
763,635 |
394,967 |
-48.3% |
| Manufacturing |
8,667 |
6,644 |
14,430 |
5,911 |
25,326 |
8,735 |
36,891 |
322.3% |
| Trans,
Comm, Pub Util |
183,025 |
163,062 |
138,629 |
136,379 |
135,580 |
152,078 |
188,762 |
24.1% |
| Wholesale |
82,638 |
22,656 |
13,490 |
7,040 |
17,477 |
26,237 |
22,059 |
-15.9% |
| Retail |
727,459 |
752,524 |
758,967 |
690,215 |
711,358 |
722,686 |
745,371 |
3.1% |
| Finance,
Ins, Real Estate |
32,952 |
24,750 |
17,006 |
8,734 |
242,188 |
10,170 |
424,120 |
4070.3% |
| Services |
317,528 |
305,603 |
240,048 |
257,751 |
278,014 |
276,869 |
272,455 |
-1.6% |
| Total |
1,388,188 |
1,526,900 |
1,473,305 |
1,155,055 |
1,629,455 |
1,971,670 |
2,084,625 |
5.7% |
| Annual
Change |
|
10.0% |
-3.5% |
-21.6% |
41.1% |
21.0% |
5.7% |
|
|


