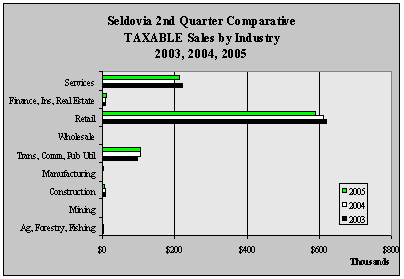
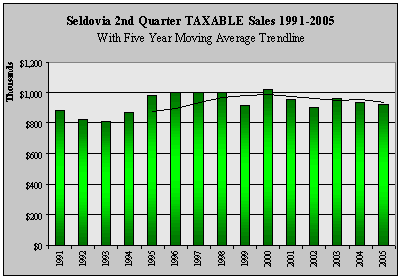
| Seldovia 2nd Quarter TAXABLE
Sales by Industry - 1999-2005 - in $ |
| |
1999 |
2000 |
2001 |
2002 |
2003 |
2004 |
2005 |
Annual
Change |
| Ag,
Forestry, Fishing |
2,605 |
2,771 |
3,616 |
3,551 |
2,970 |
3,140 |
0 |
NA |
| Mining |
0 |
0 |
0 |
0 |
0 |
0 |
0 |
NA |
| Construction |
9,564 |
11,054 |
9,498 |
9,130 |
9,946 |
8,058 |
5,615 |
-30.3% |
| Manufacturing |
2,478 |
867 |
1,243 |
1,806 |
1,749 |
2,135 |
2,819 |
32.0% |
| Trans,
Comm, Pub Util |
119,047 |
118,630 |
94,825 |
95,299 |
96,701 |
105,084 |
103,684 |
-1.3% |
| Wholesale |
2,714 |
2,227 |
1,305 |
135 |
321 |
137 |
51 |
-62.8% |
| Retail |
543,204 |
631,517 |
657,146 |
590,349 |
620,851 |
613,360 |
591,323 |
-3.6% |
| Finance,
Ins, Real Estate |
17,095 |
8,996 |
7,434 |
6,144 |
9,430 |
8,540 |
10,740 |
25.8% |
| Services |
219,255 |
242,193 |
180,966 |
192,416 |
220,998 |
199,135 |
212,476 |
6.7% |
| Total |
915,962 |
1,018,255 |
956,033 |
898,830 |
962,966 |
939,589 |
926,708 |
-1.4% |
| Annual
Change |
|
11.2% |
-6.1% |
-6.0% |
7.1% |
-2.4% |
-1.4% |
|
|


