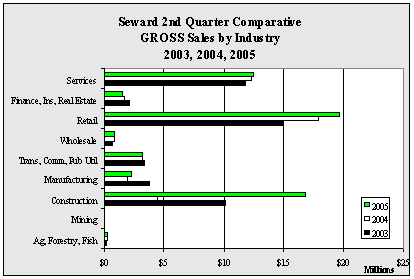
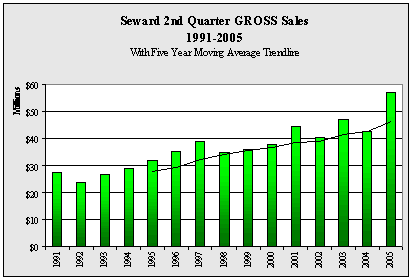
| Seward
2nd Quarter GROSS Sales by Industry - 1999-2005 - in $ |
| |
1999 |
2000 |
2001 |
2002 |
2003 |
2004 |
2005 |
Annual
Change |
| Ag,
Forestry, Fish |
211,247 |
285,558 |
170,823 |
153,308 |
180,817 |
271,027 |
288,152 |
6.3% |
| Mining |
105,031 |
144,691 |
105,401 |
131,150 |
49,589 |
78,789 |
67,545 |
-14.3% |
| Construction |
3,643,178 |
2,944,466 |
8,043,831 |
2,363,700 |
10,116,956 |
4,487,357 |
16,823,172 |
274.9% |
| Manufacturing |
1,498,102 |
1,998,984 |
3,697,117 |
3,261,062 |
3,785,614 |
1,922,115 |
2,257,300 |
17.4% |
| Trans,
Comm, Pub Util |
3,076,349 |
4,147,565 |
3,524,903 |
3,404,989 |
3,313,681 |
3,233,313 |
3,167,744 |
-2.0% |
| Wholesale |
1,086,340 |
901,036 |
671,328 |
671,893 |
682,756 |
910,240 |
899,290 |
-1.2% |
| Retail |
13,298,656 |
14,348,724 |
15,137,856 |
15,310,055 |
14,977,089 |
17,943,071 |
19,624,964 |
9.4% |
| Finance,
Ins, Real Estate |
2,453,806 |
2,295,798 |
1,147,228 |
2,345,636 |
2,106,421 |
1,663,066 |
1,567,281 |
-5.8% |
| Services |
10,668,616 |
10,947,215 |
11,953,791 |
12,743,583 |
11,771,230 |
12,251,822 |
12,422,129 |
1.4% |
| Total |
36,041,325 |
38,014,037 |
44,452,278 |
40,385,376 |
46,984,153 |
42,760,800 |
57,117,577 |
33.6% |
| Annual
Change |
|
5.5% |
16.9% |
-9.1% |
16.3% |
-9.0% |
33.6% |
|
|


