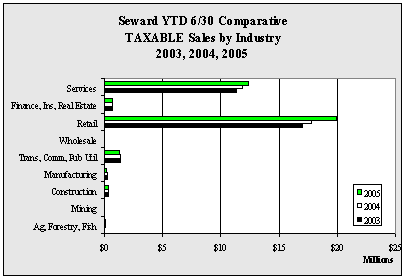
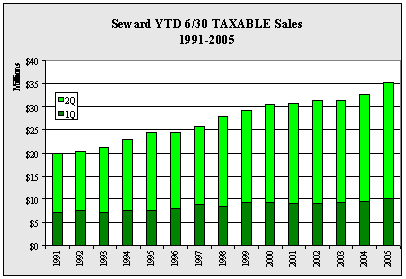
| Seward YTD 6/30 TAXABLE Sales by
Industry - 1999-2005 - in $ |
| |
1999 |
2000 |
2001 |
2002 |
2003 |
2004 |
2005 |
Annual
Change |
| Ag,
Forestry, Fish |
71,444 |
91,048 |
73,760 |
64,476 |
82,178 |
89,793 |
96,281 |
7.2% |
| Mining |
1,444 |
500 |
0 |
0 |
1,754 |
0 |
0 |
NA
|
| Construction |
334,394 |
347,827 |
290,284 |
269,565 |
316,931 |
366,212 |
371,011 |
1.3% |
| Manufacturing |
315,302 |
319,765 |
437,079 |
415,022 |
301,991 |
294,260 |
221,112 |
-24.9% |
| Trans,
Comm, Pub Util |
1,658,948 |
1,854,074 |
1,448,530 |
1,341,601 |
1,394,995 |
1,340,392 |
1,290,938 |
-3.7% |
| Wholesale |
69,200 |
74,543 |
71,113 |
50,767 |
55,355 |
58,442 |
49,045 |
-16.1% |
| Retail |
14,929,459 |
15,961,656 |
16,192,627 |
16,567,714 |
17,066,590 |
17,791,488 |
19,948,004 |
12.1% |
| Finance,
Ins, Real Estate |
825,936 |
748,972 |
797,533 |
843,326 |
745,821 |
690,476 |
740,298 |
7.2% |
| Services |
10,919,737 |
11,136,873 |
11,315,831 |
11,675,047 |
11,390,970 |
11,860,746 |
12,414,663 |
4.7% |
| Total |
29,125,864 |
30,535,258 |
30,626,757 |
31,227,518 |
31,356,585 |
32,491,809 |
35,131,352 |
8.1% |
| Annual
Change |
|
4.8% |
0.3% |
2.0% |
0.4% |
3.6% |
8.1% |
|
|


