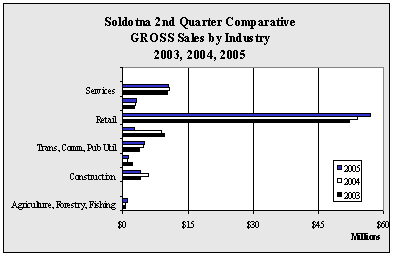
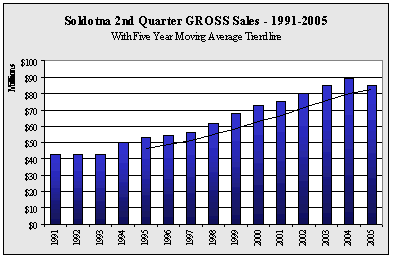
| Soldotna 2nd Quarter GROSS Sales
by Industry - 1999-2005 - in $ |
| |
1999 |
2000 |
2001 |
2002 |
2003 |
2004 |
2005 |
Annual
Change |
| Agriculture,
Forestry, Fishing |
228,635 |
379,092 |
486,756 |
493,143 |
558,058 |
645,572 |
1,027,906 |
59.2% |
| Mining |
103,776 |
80,235 |
77,886 |
106,949 |
122,012 |
154,892 |
185,929 |
20.0% |
| Construction |
3,171,056 |
4,925,887 |
4,464,446 |
4,934,965 |
3,954,148 |
5,879,390 |
4,168,075 |
-29.1% |
| Manufacturing |
764,920 |
1,149,365 |
1,611,027 |
1,727,614 |
2,288,148 |
1,132,457 |
1,352,876 |
19.5% |
| Trans,
Comm, Pub Util |
4,379,100 |
3,684,195 |
4,573,146 |
3,531,451 |
3,827,252 |
4,716,238 |
4,974,094 |
5.5% |
| Wholesale |
6,802,549 |
8,721,917 |
6,981,240 |
7,353,520 |
9,554,591 |
8,967,548 |
2,653,447 |
-70.4% |
| Retail |
42,762,715 |
42,547,382 |
45,690,237 |
49,060,629 |
52,189,612 |
54,023,404 |
57,022,596 |
5.6% |
| Finance,
Ins, Real Estate |
2,036,799 |
2,743,036 |
2,223,114 |
2,983,720 |
2,547,857 |
2,956,541 |
3,005,670 |
1.7% |
| Services |
7,618,629 |
8,278,327 |
8,929,421 |
9,561,798 |
10,128,839 |
10,824,252 |
10,531,672 |
-2.7% |
| Government |
6,763 |
5,779 |
5,238 |
7,859 |
8,680 |
8,521 |
8,502 |
-0.2% |
| Total |
67,874,942 |
72,515,215 |
75,042,511 |
79,761,648 |
85,179,197 |
89,308,815 |
84,930,767 |
-4.9% |
| Annual
Change |
|
6.8% |
3.5% |
6.3% |
6.8% |
4.8% |
-4.9% |
|
|


