| Soldotna 2nd Quarter TAXABLE Sales by Industry -
1999-2005 - in $ |
| |
1999 |
2000 |
2001 |
2002 |
2003 |
2004 |
2005 |
Annual
Change |
| Agriculture,
Forestry, Fishing |
170,588 |
227,222 |
314,053 |
286,565 |
297,426 |
270,912 |
263,246 |
-2.8% |
| Mining |
2,450 |
6,707 |
10,242 |
7,414 |
7,401 |
5,828 |
7,089 |
21.6% |
| Construction |
391,321 |
290,180 |
301,807 |
329,803 |
430,437 |
377,000 |
376,169 |
-0.2% |
| Manufacturing |
371,397 |
412,829 |
465,257 |
429,327 |
436,364 |
375,725 |
404,803 |
7.7% |
| Trans,
Comm, Pub Util |
2,502,149 |
2,571,379 |
2,584,818 |
2,619,156 |
2,964,183 |
2,985,335 |
2,791,932 |
-6.5% |
| Wholesale |
80,275 |
229,376 |
282,881 |
231,064 |
288,627 |
254,535 |
262,964 |
3.3% |
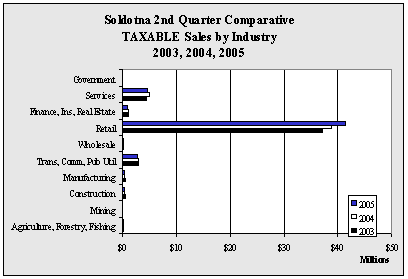
| Retail |
29,826,099 |
29,942,234 |
33,538,956 |
33,723,015 |
36,976,302 |
38,707,449 |
41,420,387 |
7.0% |
| Finance,
Ins, Real Estate |
913,453 |
1,066,696 |
1,222,567 |
1,266,667 |
1,151,616 |
1,130,865 |
1,038,171 |
-8.2% |
| Services |
3,940,745 |
4,014,214 |
4,188,255 |
4,603,064 |
4,457,613 |
4,894,259 |
4,525,075 |
-7.5% |
| Government |
6,763 |
5,779 |
5,238 |
7,859 |
8,680 |
8,521 |
8,502 |
-0.2% |
| Total |
38,205,240 |
38,766,616 |
42,914,074 |
43,503,934 |
47,018,649 |
49,010,429 |
51,098,338 |
4.3% |
| Annual
Change |
|
1.5% |
10.7% |
1.4% |
8.1% |
4.2% |
4.3% |
|
|