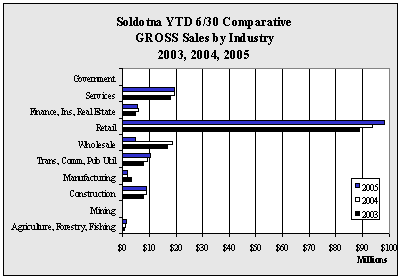
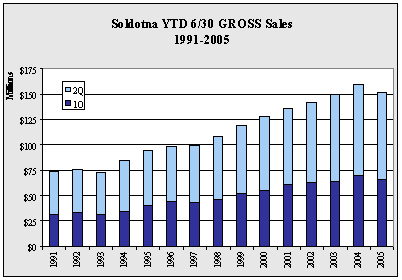
| Soldotna
YTD 6/30 GROSS Sales by Industry - 1999-2005 - in $ |
| |
1999 |
2000 |
2001 |
2002 |
2003 |
2004 |
2005 |
Annual
Change |
| Agriculture,
Forestry, Fishing |
326,589 |
537,274 |
701,976 |
724,497 |
845,479 |
1,202,557 |
1,606,359 |
33.6% |
| Mining |
150,828 |
151,497 |
127,358 |
205,050 |
232,641 |
247,073 |
275,968 |
11.7% |
| Construction |
5,478,677 |
7,970,298 |
8,479,817 |
8,163,007 |
7,952,066 |
8,836,233 |
8,795,618 |
-0.5% |
| Manufacturing |
1,246,224 |
1,790,910 |
2,578,965 |
2,628,508 |
3,417,539 |
1,676,240 |
1,866,624 |
11.4% |
| Trans,
Comm, Pub Util |
8,370,737 |
7,723,804 |
9,337,601 |
7,217,176 |
8,038,579 |
9,513,194 |
10,369,947 |
9.0% |
| Wholesale |
12,602,036 |
16,000,696 |
13,808,302 |
15,425,570 |
16,863,880 |
18,687,699 |
4,744,170 |
-74.6% |
| Retail |
73,276,500 |
74,075,518 |
80,405,486 |
85,547,876 |
88,977,313 |
93,630,319 |
97,928,656 |
4.6% |
| Finance,
Ins, Real Estate |
4,136,959 |
4,719,431 |
4,389,995 |
5,241,923 |
5,009,155 |
5,989,462 |
5,804,319 |
-3.1% |
| Services |
13,696,783 |
14,734,617 |
16,003,543 |
16,925,232 |
18,055,264 |
19,422,101 |
19,464,540 |
0.2% |
| Government |
19,589 |
13,066 |
11,745 |
14,559 |
20,999 |
15,425 |
10,399 |
-32.6% |
| Total |
119,304,922 |
127,717,111 |
135,844,788 |
142,093,398 |
149,412,915 |
159,220,303 |
150,866,600 |
-5.2% |
| Annual
Change |
|
7.1% |
6.4% |
4.6% |
5.2% |
6.6% |
-5.2% |
|
|


