| Kenai Peninsula Borough |
| 144 North Binkley Street Soldotna, AK 99669 |
| Phone - (907) 262-4441 or (800) 478-4441 or on the web www.borough.kenai.ak.us |
Kenai Peninsula Borough - The Bigger Picture
| Demographics
Census Data,
Area Density -2000 Population by Age Group
- 1990 to 2000 Labor Force - 2005 2006 Earnings - 2006 by LOB 2003-2006 Total Earnings County Business Patterns Kenai Peninsula Borough Anchorage Municipality Fairbanks Northstar Borough Juneau Borough Matanuska-Susitna Borough Federal Funds Municipal Taxation School Revenue State Taxes |
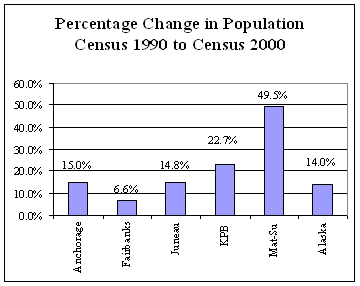
| Percent
Change in Population Census 1990 to Census 2000 |
|||
| 1990 | 2000 | Change | |
| Anchorage | 226,338 | 260,283 | 15.0% |
| Fairbanks | 77,720 | 82,840 | 6.6% |
| Juneau | 26,751 | 30,711 | 14.8% |
| KPB | 40,502 | 49,691 | 22.7% |
| Mat-Su | 39,683 | 59,322 | 49.5% |
| Alaska | 550,043 | 626,931 | 14.0% |
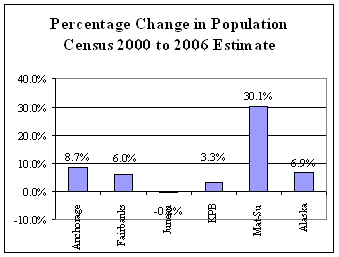
| Percent
Change in Population Census 2000 to 2006 Estimate |
|||
| 2000 | 2006 | 6 Yr Change | |
| Anchorage | 260,283 | 282,813 | 8.7% |
| Fairbanks | 82,840 | 87,849 | 6.0% |
| Juneau | 30,711 | 30,650 | -0.2% |
| KPB | 49,691 | 51,350 | 3.3% |
| Mat-Su | 59,322 | 77,174 | 30.1% |
| Alaska | 626,931 | 670,053 | 6.9% |
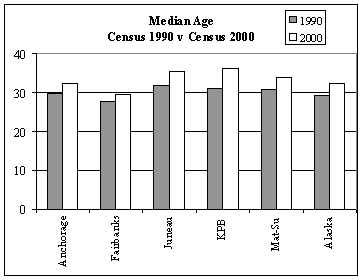
| Median
Age Census 1990 v Census 2000 |
|||
| 1990 | 2000 | Percent Change |
|
| Anchorage | 29.8 | 32.4 | 8.7% |
| Fairbanks | 27.6 | 29.5 | 6.9% |
| Juneau | 31.9 | 35.3 | 10.7% |
| KPB | 31.1 | 36.3 | 16.7% |
| Mat-Su | 30.8 | 34.1 | 10.7% |
| Alaska | 29.3 | 32.4 | 10.6% |
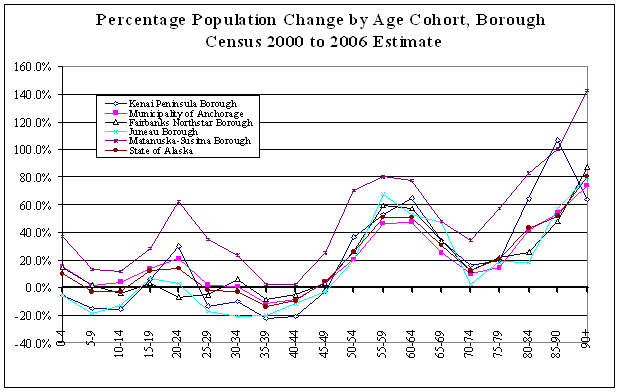
| Percentage Change of Population by Age Cohort, Borough - 2000-2006 | ||||||
| Age | Kenai Peninsula Borough | Municipality of Anchorage | Fairbanks Northstar Borough | Juneau Borough | Matanuska-Susitna Borough | State of Alaska |
| 0-4 | -5.5% | 15.6% | 14.7% | -5.9% | 37.4% | 10.2% |
| 5-9 | -15.2% | 1.4% | 1.7% | -19.0% | 13.4% | -2.8% |
| 10-14 | -15.4% | 3.8% | -4.4% | -13.1% | 11.5% | -2.9% |
| 15-19 | 6.3% | 13.6% | 3.0% | 6.5% | 28.5% | 12.0% |
| 20-24 | 29.9% | 20.9% | -6.6% | 2.7% | 62.0% | 13.7% |
| 25-29 | -13.4% | 2.1% | -5.2% | -17.4% | 35.1% | -1.7% |
| 30-34 | -10.0% | 0.6% | 6.2% | -21.1% | 23.7% | -3.1% |
| 35-39 | -22.1% | -11.5% | -8.6% | -19.9% | 2.3% | -14.0% |
| 40-44 | -20.9% | -8.6% | -5.2% | -11.9% | 2.1% | -9.5% |
| 45-49 | -2.5% | 4.2% | 2.7% | -2.5% | 25.2% | 4.4% |
| 50-54 | 36.4% | 20.2% | 26.1% | 19.5% | 70.1% | 26.0% |
| 55-59 | 53.0% | 46.5% | 59.6% | 67.4% | 80.2% | 50.5% |
| 60-64 | 65.1% | 47.8% | 57.0% | 52.7% | 77.2% | 50.8% |
| 65-69 | 33.7% | 25.1% | 34.1% | 47.6% | 47.8% | 30.8% |
| 70-74 | 16.2% | 9.9% | 12.8% | 2.2% | 34.4% | 12.1% |
| 75-79 | 19.8% | 14.5% | 21.9% | 18.5% | 57.1% | 20.9% |
| 80-84 | 64.2% | 41.7% | 25.9% | 18.1% | 83.0% | 43.0% |
| 85-90 | 106.9% | 54.1% | 47.9% | 57.4% | 100.0% | 52.0% |
| 90+ | 63.8% | 74.1% | 87.4% | 79.6% | 142.4% | 80.6% |
| Overall Change | 3.30% | 8.70% | 6.00% | 0.20% | 30.10% | 6.9% |
| Median Age | ||||||
| 2000 | 36.3 | 32.4 | 29.5 | 35.3 | 34.1 | 32.4 |
| 2006 | 39.7 | 32.4 | 31.2 | 38.8 | 34.9 | 33.5 |
| Kenai Peninsula Borough Home Page Economic Analysis Office Home Page Economic Analysis Index |