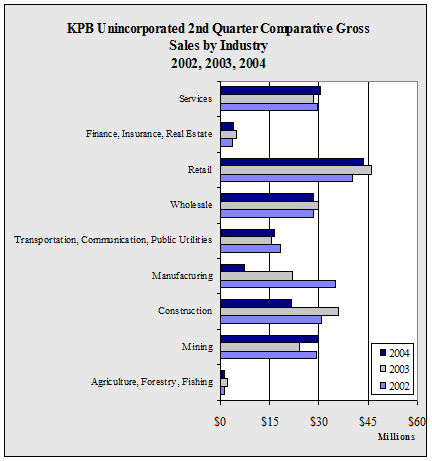
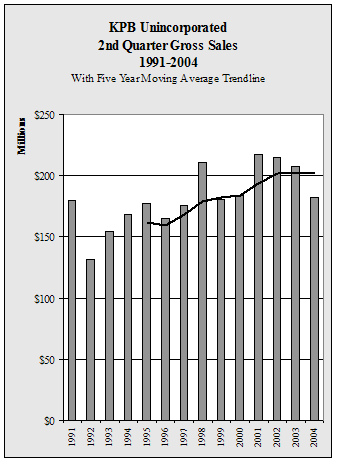
| KPB
Unincorporated 2nd Quarter Gross Sales by Industry - 1998-2004 - in
$ |
| |
1998 |
1999 |
2000 |
2001 |
2002 |
2003 |
2004 |
Annual
Change |
| Agriculture,
Forestry, Fishing |
1,546,455 |
1,006,214 |
895,333 |
1,133,165 |
1,142,492 |
2,042,231 |
973,195 |
-52.3% |
| Mining |
50,512,203 |
25,197,119 |
25,208,965 |
25,603,580 |
29,103,164 |
24,039,296 |
29,493,053 |
22.7% |
| Construction |
20,391,951 |
20,589,328 |
20,563,736 |
26,701,467 |
30,741,092 |
35,935,472 |
21,351,927 |
-40.6% |
| Manufacturing |
30,125,875 |
29,640,273 |
26,397,183 |
46,327,693 |
34,871,253 |
22,050,431 |
7,340,741 |
-66.7% |
| Transportation,
Communication, Public Utilities |
18,348,120 |
18,812,079 |
15,437,379 |
17,129,688 |
18,167,731 |
15,634,861 |
16,534,203 |
5.8% |
| Wholesale |
26,053,800 |
23,318,497 |
26,003,440 |
25,984,914 |
28,469,316 |
29,652,374 |
28,319,318 |
-4.5% |
| Retail |
36,181,566 |
34,927,187 |
37,141,035 |
41,041,604 |
40,135,079 |
45,910,986 |
43,481,774 |
-5.3% |
| Finance,
Insurance, Real Estate |
4,893,086 |
4,083,396 |
3,698,129 |
4,612,998 |
3,703,483 |
4,573,702 |
3,754,374 |
-17.9% |
| Services |
23,138,908 |
23,135,453 |
28,632,317 |
29,076,885 |
29,374,137 |
28,117,989 |
30,563,556 |
8.7% |
| Government |
0 |
0 |
0 |
0 |
0 |
0 |
0 |
NA |
| Total |
211,191,964 |
180,709,546 |
183,977,517 |
217,611,994 |
215,707,747 |
207,957,342 |
181,812,141 |
-12.6% |
| Annual
Change |
|
-14.4% |
1.8% |
18.3% |
-0.9% |
-3.6% |
-12.6% |
|
|


