| KPB
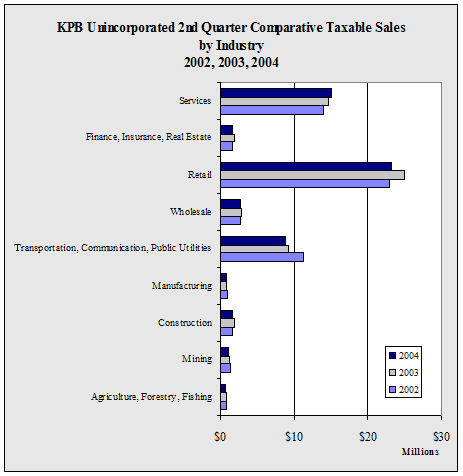
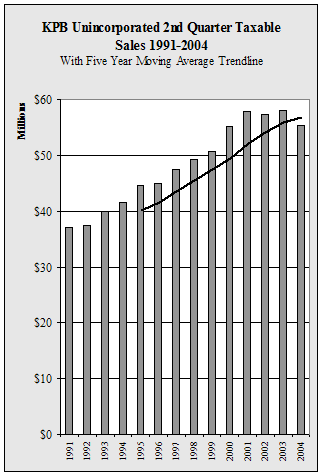
Unincorporated 2nd Quarter Taxable Sales by Industry - 1998-2004 -
in $ |
| |
1998 |
1999 |
2000 |
2001 |
2002 |
2003 |
2004 |
Annual
Change |
| Agriculture,
Forestry, Fishing |
602,631 |
624,351 |
688,139 |
755,318 |
780,587 |
859,055 |
657,861 |
-23.4% |
| Mining |
1,305,288 |
926,985 |
1,046,589 |
1,265,086 |
1,417,403 |
1,114,615 |
996,105 |
-10.6% |
| Construction |
1,554,297 |
1,362,150 |
1,497,925 |
1,567,045 |
1,656,928 |
1,886,552 |
1,573,326 |
-16.6% |
| Manufacturing |
983,798 |
902,042 |
935,882 |
892,944 |
881,441 |
792,161 |
748,304 |
-5.5% |
| Transportation,
Communication, Public Utilities |
8,736,957 |
9,207,004 |
9,290,261 |
9,844,493 |
11,314,077 |
9,184,673 |
8,896,201 |
-3.1% |
| Wholesale |
1,976,804 |
2,231,807 |
2,624,808 |
2,722,910 |
2,743,971 |
2,861,811 |
2,782,325 |
-2.8% |
| Retail |
20,441,904 |
20,784,479 |
22,599,875 |
23,656,930 |
22,918,629 |
24,938,746 |
23,179,661 |
-7.1% |
| Finance,
Insurance, Real Estate |
1,460,259 |
1,494,811 |
1,494,079 |
1,694,631 |
1,625,636 |
1,840,158 |
1,576,103 |
-14.3% |
| Services |
12,180,840 |
13,212,897 |
15,027,499 |
15,479,273 |
14,017,288 |
14,601,321 |
15,100,022 |
3.4% |
| Government |
0 |
0 |
0 |
0 |
0 |
0 |
0 |
NA |
| Total |
49,242,778 |
50,746,526 |
55,205,057 |
57,878,630 |
57,355,960 |
58,079,092 |
55,509,908 |
-4.4% |
| Annual
Change |
|
3.1% |
8.8% |
4.8% |
-0.9% |
1.3% |
-4.4% |
|
|


