| KPB
Unincorporated YTD 6/30 Gross Sales by Industry - 1998-2004 - in $ |
| |
1998 |
1999 |
2000 |
2001 |
2002 |
2003 |
2004 |
Annual
Change |
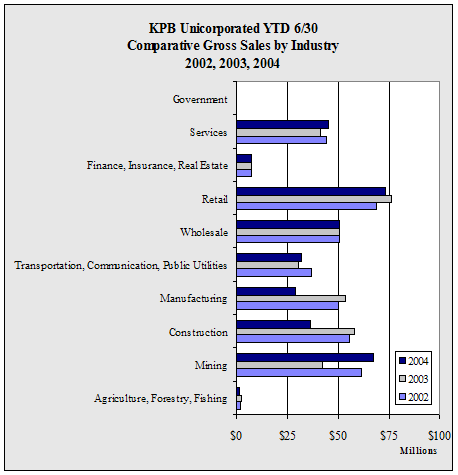
| Agriculture,
Forestry, Fishing |
2,261,321 |
1,358,425 |
1,247,615 |
1,656,703 |
1,590,143 |
2,487,316 |
1,408,223 |
-43.4% |
| Mining |
100,591,704 |
59,647,978 |
43,489,424 |
52,852,431 |
61,402,416 |
42,178,318 |
67,165,281 |
59.2% |
| Construction |
30,007,483 |
31,104,194 |
32,640,967 |
48,378,424 |
55,308,835 |
57,951,464 |
36,376,190 |
-37.2% |
| Manufacturing |
49,522,049 |
49,144,018 |
46,359,763 |
87,384,091 |
49,825,823 |
53,712,724 |
29,281,721 |
-45.5% |
| Transportation,
Communication, Public Utilities |
35,461,018 |
36,812,851 |
31,124,269 |
33,850,617 |
36,588,703 |
30,232,931 |
31,485,668 |
4.1% |
| Wholesale |
47,059,971 |
41,106,850 |
45,620,628 |
46,257,033 |
50,412,457 |
50,600,896 |
50,253,708 |
-0.7% |
| Retail |
59,371,308 |
57,085,718 |
62,943,669 |
68,018,252 |
68,679,992 |
76,426,255 |
73,240,544 |
-4.2% |
| Finance,
Insurance, Real Estate |
7,612,305 |
7,230,938 |
6,735,862 |
7,863,181 |
6,917,445 |
7,374,314 |
7,495,787 |
1.6% |
| Services |
32,912,427 |
34,665,546 |
40,480,301 |
41,853,109 |
44,347,415 |
41,346,960 |
44,943,138 |
8.7% |
| Government |
0 |
0 |
0 |
0 |
0 |
0 |
6,365 |
NA |
| Total |
364,799,586 |
318,156,518 |
310,642,498 |
388,113,841 |
375,073,229 |
362,311,178 |
341,656,625 |
-5.7% |
| Annual
Change |
|
-12.8% |
-2.4% |
24.9% |
-3.4% |
-3.4% |
-5.7% |
|
|