| KPB
Unincorporated YTD 6/30 Taxable Sales by Industry - 1998-2004 - in $ |
| |
1998 |
1999 |
2000 |
2001 |
2002 |
2003 |
2004 |
Annual
Change |
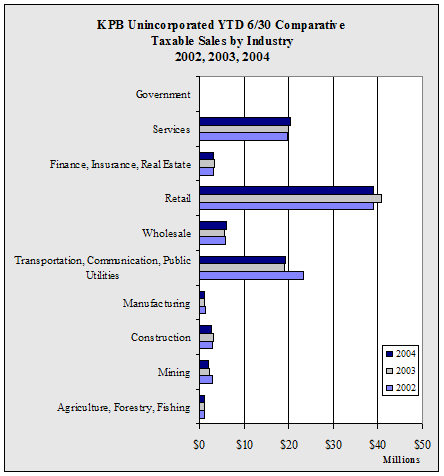
| Agriculture,
Forestry, Fishing |
879,300 |
875,083 |
984,247 |
1,098,152 |
1,177,104 |
1,219,206 |
1,058,118 |
-13.2% |
| Mining |
2,955,713 |
1,683,259 |
1,916,427 |
2,424,873 |
2,841,477 |
2,304,740 |
1,976,271 |
-14.3% |
| Construction |
2,342,853 |
2,378,252 |
2,442,917 |
2,643,677 |
2,788,861 |
3,027,944 |
2,740,633 |
-9.5% |
| Manufacturing |
1,400,488 |
1,291,165 |
1,283,455 |
1,301,057 |
1,278,092 |
1,147,304 |
1,114,112 |
-2.9% |
| Transportation,
Communication, Public Utilities |
18,006,631 |
19,411,130 |
19,195,294 |
20,282,481 |
23,454,900 |
19,101,385 |
19,153,362 |
0.3% |
| Wholesale |
4,173,194 |
4,414,317 |
5,137,992 |
5,303,572 |
5,609,365 |
5,577,926 |
6,051,761 |
8.5% |
| Retail |
33,694,101 |
34,105,699 |
36,887,838 |
38,729,710 |
39,020,564 |
40,823,467 |
39,002,005 |
-4.5% |
| Finance,
Insurance, Real Estate |
2,730,237 |
2,779,459 |
2,723,561 |
3,018,263 |
3,131,412 |
3,292,035 |
3,056,405 |
-7.2% |
| Services |
16,553,017 |
18,156,630 |
20,329,687 |
21,114,641 |
19,844,480 |
19,900,918 |
20,312,067 |
2.1% |
| Government |
0 |
0 |
0 |
0 |
0 |
0 |
6,300 |
NA |
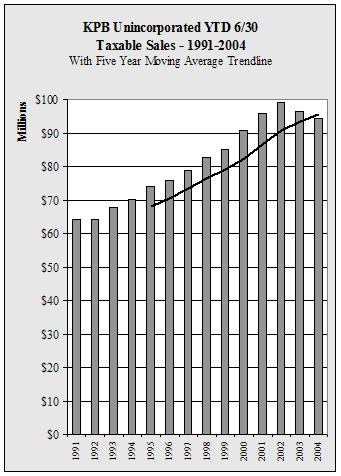
| Total |
82,735,534 |
85,094,994 |
90,901,418 |
95,916,426 |
99,146,255 |
96,394,925 |
94,471,034 |
-2.0% |
| Annual
Change |
|
2.9% |
6.8% |
5.5% |
3.4% |
-2.8% |
-2.0% |
|
|