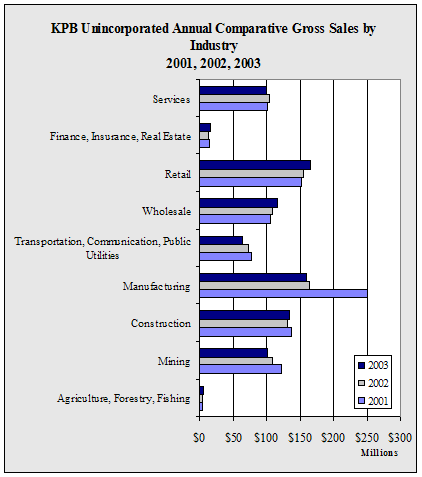
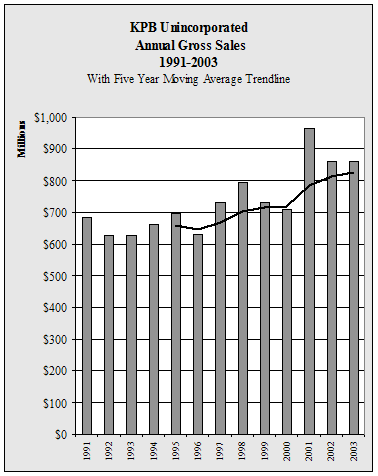
| KPB
Unincorporated Annual Gross Sales by Industry - 1997-2003 - in $ |
| |
1997 |
1998 |
1999 |
2000 |
2001 |
2002 |
2003 |
Annual
Change |
| Agriculture,
Forestry, Fishing |
8,277,304 |
6,119,386 |
2,812,823 |
2,875,629 |
3,220,463 |
4,090,590 |
4,814,409 |
17.7% |
| Mining |
134,556,028 |
187,521,559 |
113,163,554 |
115,625,431 |
123,091,789 |
108,808,400 |
101,004,267 |
-7.2% |
| Construction |
80,841,162 |
88,142,507 |
87,808,495 |
88,676,528 |
136,282,121 |
131,148,296 |
133,747,278 |
2.0% |
| Manufacturing |
121,436,530 |
112,671,455 |
132,512,994 |
85,638,574 |
250,593,511 |
164,076,655 |
159,466,297 |
-2.8% |
| Transportation,
Communication, Public Utilities |
67,212,590 |
73,567,609 |
78,647,818 |
66,837,538 |
77,388,092 |
73,138,015 |
63,786,231 |
-12.8% |
| Wholesale |
98,767,981 |
101,466,620 |
91,041,042 |
101,310,365 |
104,685,508 |
108,334,825 |
115,986,698 |
7.1% |
| Retail |
128,401,693 |
128,963,750 |
128,644,968 |
137,928,377 |
151,840,391 |
153,877,729 |
165,321,069 |
7.4% |
| Finance,
Insurance, Real Estate |
18,535,160 |
15,909,441 |
15,194,140 |
13,101,745 |
15,616,436 |
14,432,476 |
16,404,711 |
13.7% |
| Services |
71,312,163 |
78,651,481 |
83,322,595 |
96,270,771 |
101,637,836 |
103,948,899 |
99,990,814 |
-3.8% |
| Total |
729,340,611 |
793,013,808 |
733,148,429 |
708,264,958 |
964,356,147 |
861,855,885 |
860,521,774 |
-0.2% |
| Annual
Change |
|
8.7% |
-7.5% |
-3.4% |
36.2% |
-10.6% |
-0.2% |
|
|


