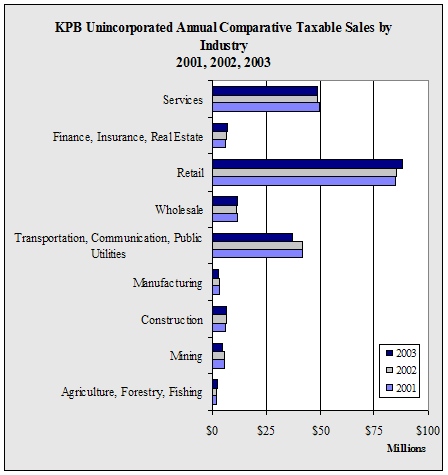
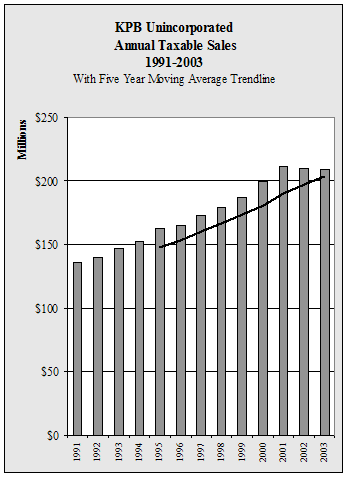
| KPB
Unincorporated Annual Taxable Sales by Industry - 1997-2003 - in $ |
| |
1997 |
1998 |
1999 |
2000 |
2001 |
2002 |
2003 |
Annual
Change |
| Agriculture,
Forestry, Fishing |
1,819,563 |
1,722,929 |
1,738,057 |
1,945,844 |
2,015,782 |
2,152,460 |
2,281,300 |
6.0% |
| Mining |
5,091,640 |
5,144,815 |
3,724,685 |
4,434,095 |
5,598,954 |
5,598,990 |
4,655,675 |
-16.8% |
| Construction |
4,834,985 |
5,738,513 |
5,621,785 |
5,724,961 |
6,109,648 |
6,565,005 |
6,590,665 |
0.4% |
| Manufacturing |
3,049,182 |
3,388,424 |
3,021,658 |
3,084,591 |
3,041,030 |
2,944,959 |
2,621,879 |
-11.0% |
| Transportation,
Communication, Public Utilities |
34,090,048 |
35,992,074 |
39,160,283 |
39,092,526 |
42,147,135 |
41,606,993 |
37,093,865 |
-10.8% |
| Wholesale |
9,555,670 |
8,733,322 |
9,868,388 |
11,100,421 |
11,675,046 |
11,425,901 |
11,820,885 |
3.5% |
| Retail |
71,802,512 |
72,533,481 |
75,119,590 |
79,800,122 |
84,664,035 |
84,912,772 |
88,292,112 |
4.0% |
| Finance,
Insurance, Real Estate |
5,394,863 |
5,494,477 |
5,585,421 |
5,674,011 |
6,354,737 |
6,505,560 |
7,015,430 |
7.8% |
| Services |
36,789,373 |
40,794,714 |
43,554,212 |
48,445,982 |
49,740,983 |
48,595,033 |
48,651,417 |
0.1% |
| Total |
172,427,836 |
179,542,749 |
187,394,079 |
199,302,553 |
211,347,350 |
210,307,673 |
209,023,228 |
-0.6% |
| Annual
Change |
|
4.1% |
4.4% |
6.4% |
6.0% |
-0.5% |
-0.6% |
|
|


